


Metals, Miners & Macro: RBE's Weekly Market Report + Portfolio Update + Top Stocks on Watch (2)
Outperformance Strategies - Gold, Silver, Miners, Bitcoin, Platinum, Palladium, Copper, Lithium, Uranium, Potash, Fertilizers, Energy

Breakouts and bullish bottom reversals all over the place in the commodity space this week.
As the US Dollar teeters on the edge of collapse, hard assets are catching a strong bid.
And it’s not just the Dollar - we’ve got multiple tailwinds aligning all at once: astronomical tariffs on copper (and other commodities), calls for 300 bps in rate cuts & the firing of Powell + government spending/debt that remains completely out of control & a global fight over critical mineral supply.
The fundamental and technical stars are aligned for a historic commodity run - something we haven’t seen since the early 2000s.
Let’s get into the charts, which will show clearly why this isn’t just hopeful fantasy - it’s a profitable reality unfolding right in front of us.
Macro Charts: Setting the Stage
Each week, we kick off with key macro charts to gauge broad commodity sector dynamics:
SPY - S&P 500 ETF
DBC - Commodity Index
USOIL - WTI Crude Oil
DXY - US Dollar Index
JX – TSX Venture Index
SPY - S&P 500 ETF

The bulls continue to march higher with price holding its short-term EMAs. The path of least resistance is higher into the $641 Yearly R1 Pivot level. From there, we’ll assess how things are looking. Risk appetite is alive and well.
DBC - Commodity Index
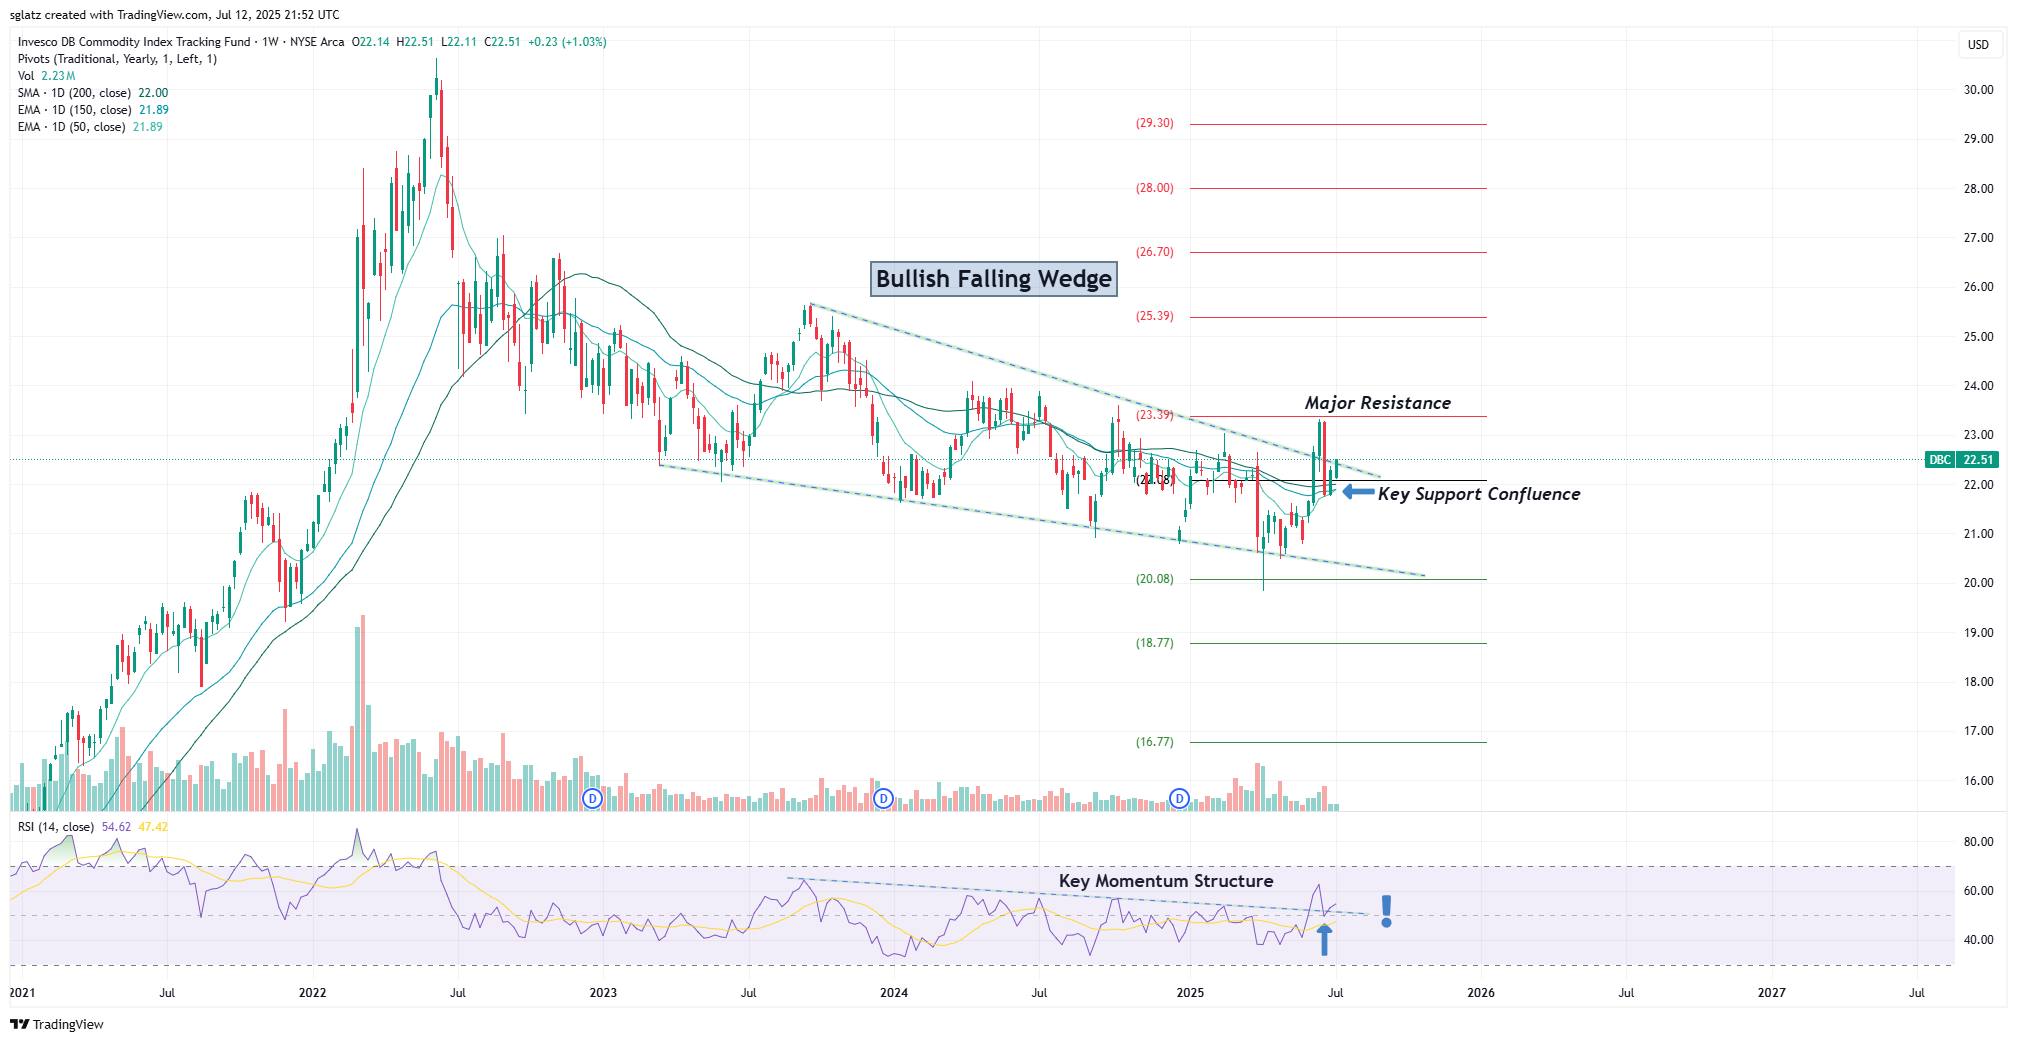
I mentioned in a recent weekly report that it’s common to expect extreme price whipsaws around major inflection points. We’re seeing that play out right now, as the commodity index attempted a breakout 4 weeks ago and was immediately sold back down into major supports. This week, we’ve received a Momentum Breakout confirmation as the Yearly Pivot + 200 SMA test was successful. This is another strong signal that we’re on the cusp of a major bull run in commodities.
USOIL - WTI Crude Oil
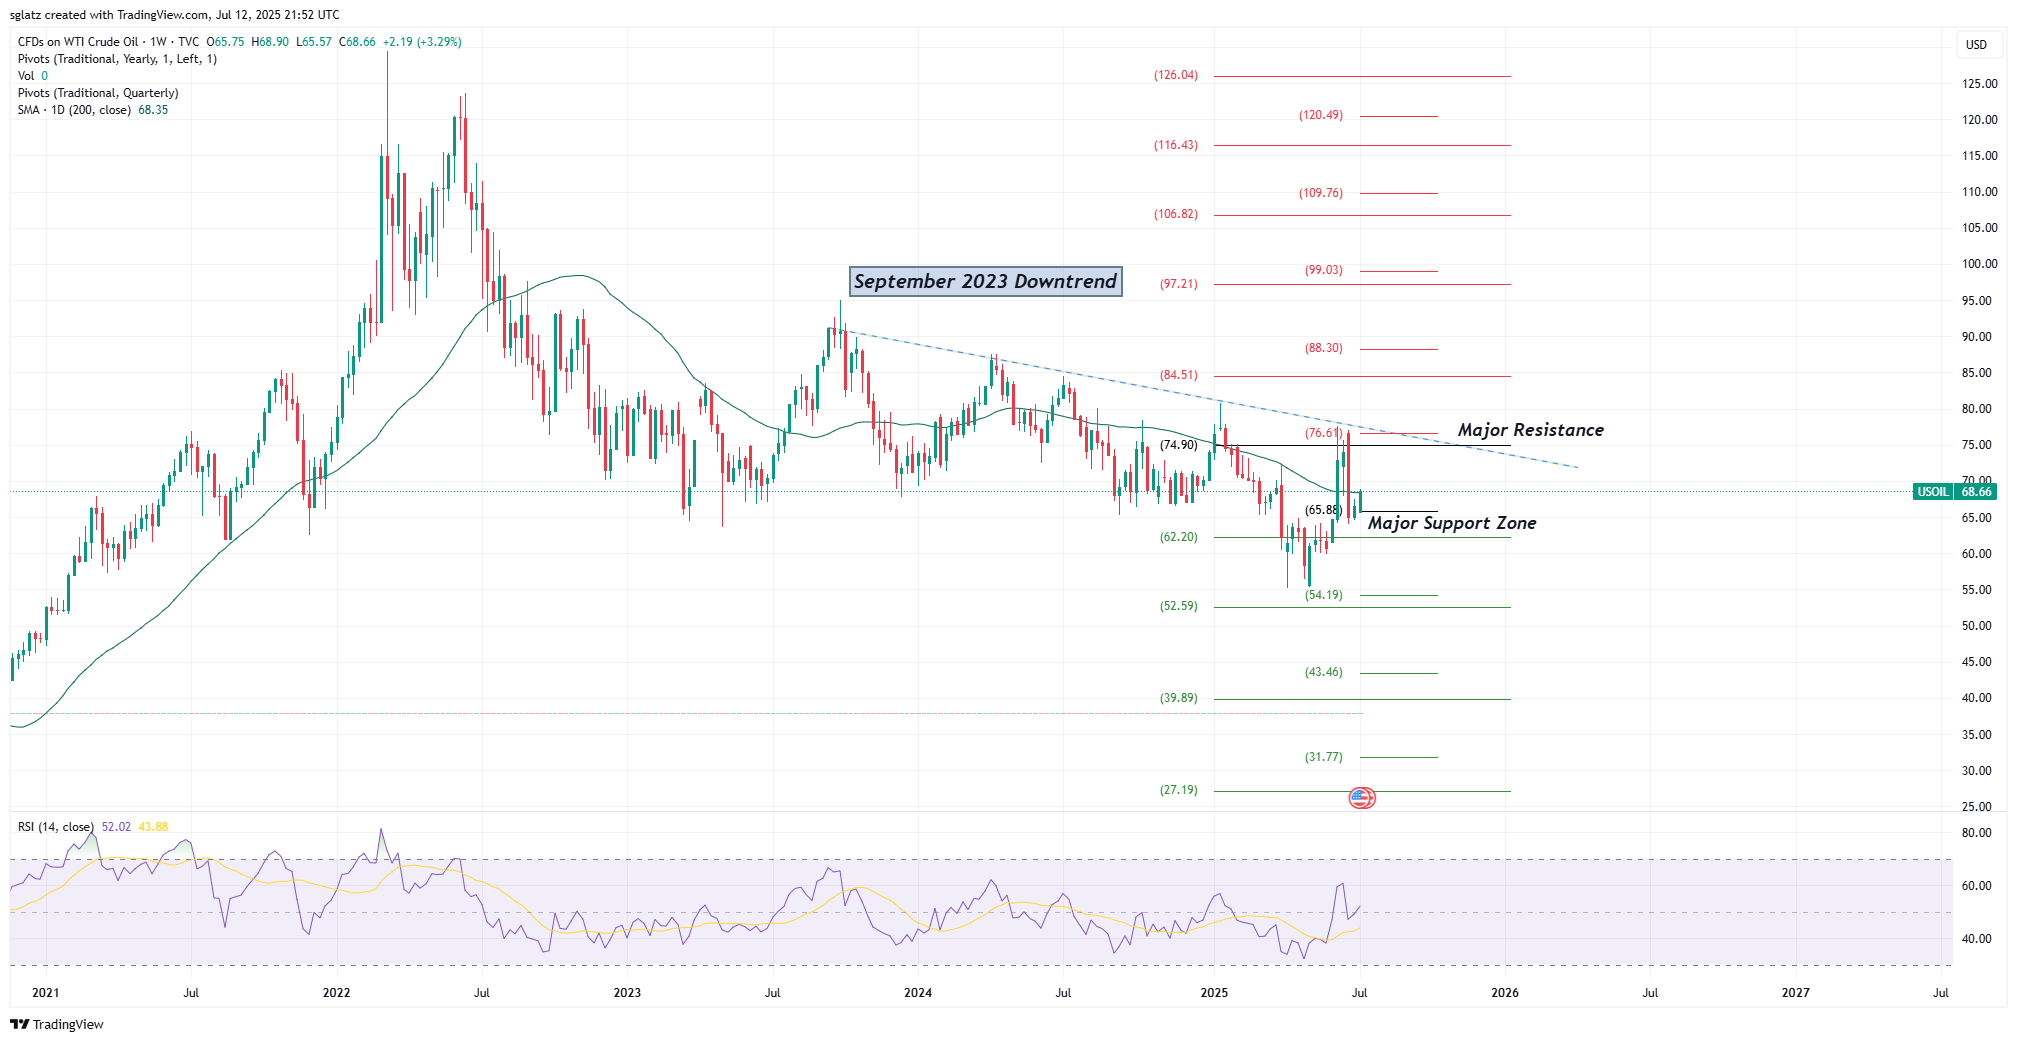
Oil closed the week just under its negatively sloping 200 SMA, which suggests there’s still a lot of overhead pressure. However, price did recently produce a False Breakdown of its critical $65 level which failed to follow through on the downside. This greatly increases the likelihood of a sharp reversal in the other direction. We can expect oil prices to be firm around these levels, adding stability to the general bid under commodities as a whole.
DXY - US Dollar Index

We expected a potential bounce in the Dollar after last week’s hammer candle. What’s been encouraging is that it hasn’t hampered the strength in commodities so far. Price could bounce higher into the 50 EMA to reset the RSI—however, it is still within a broad downtrend and the market appears to be pricing in the eventual failure of this all-too-critical 14 year uptrend support.
JX – TSX Venture Index

Price has gone vertical off the April crash lows and has broken resistance after resistance with ease. We are nearing nosebleed overbought levels on the Weekly RSI, however, and are into another major Resistance Level at the Yearly R4 extension. We could see another cooling-off period—similar to what occurred in June—where many stretched mining stocks entered shallow corrections in order to stabilize for the next leg higher.
Bitcoin
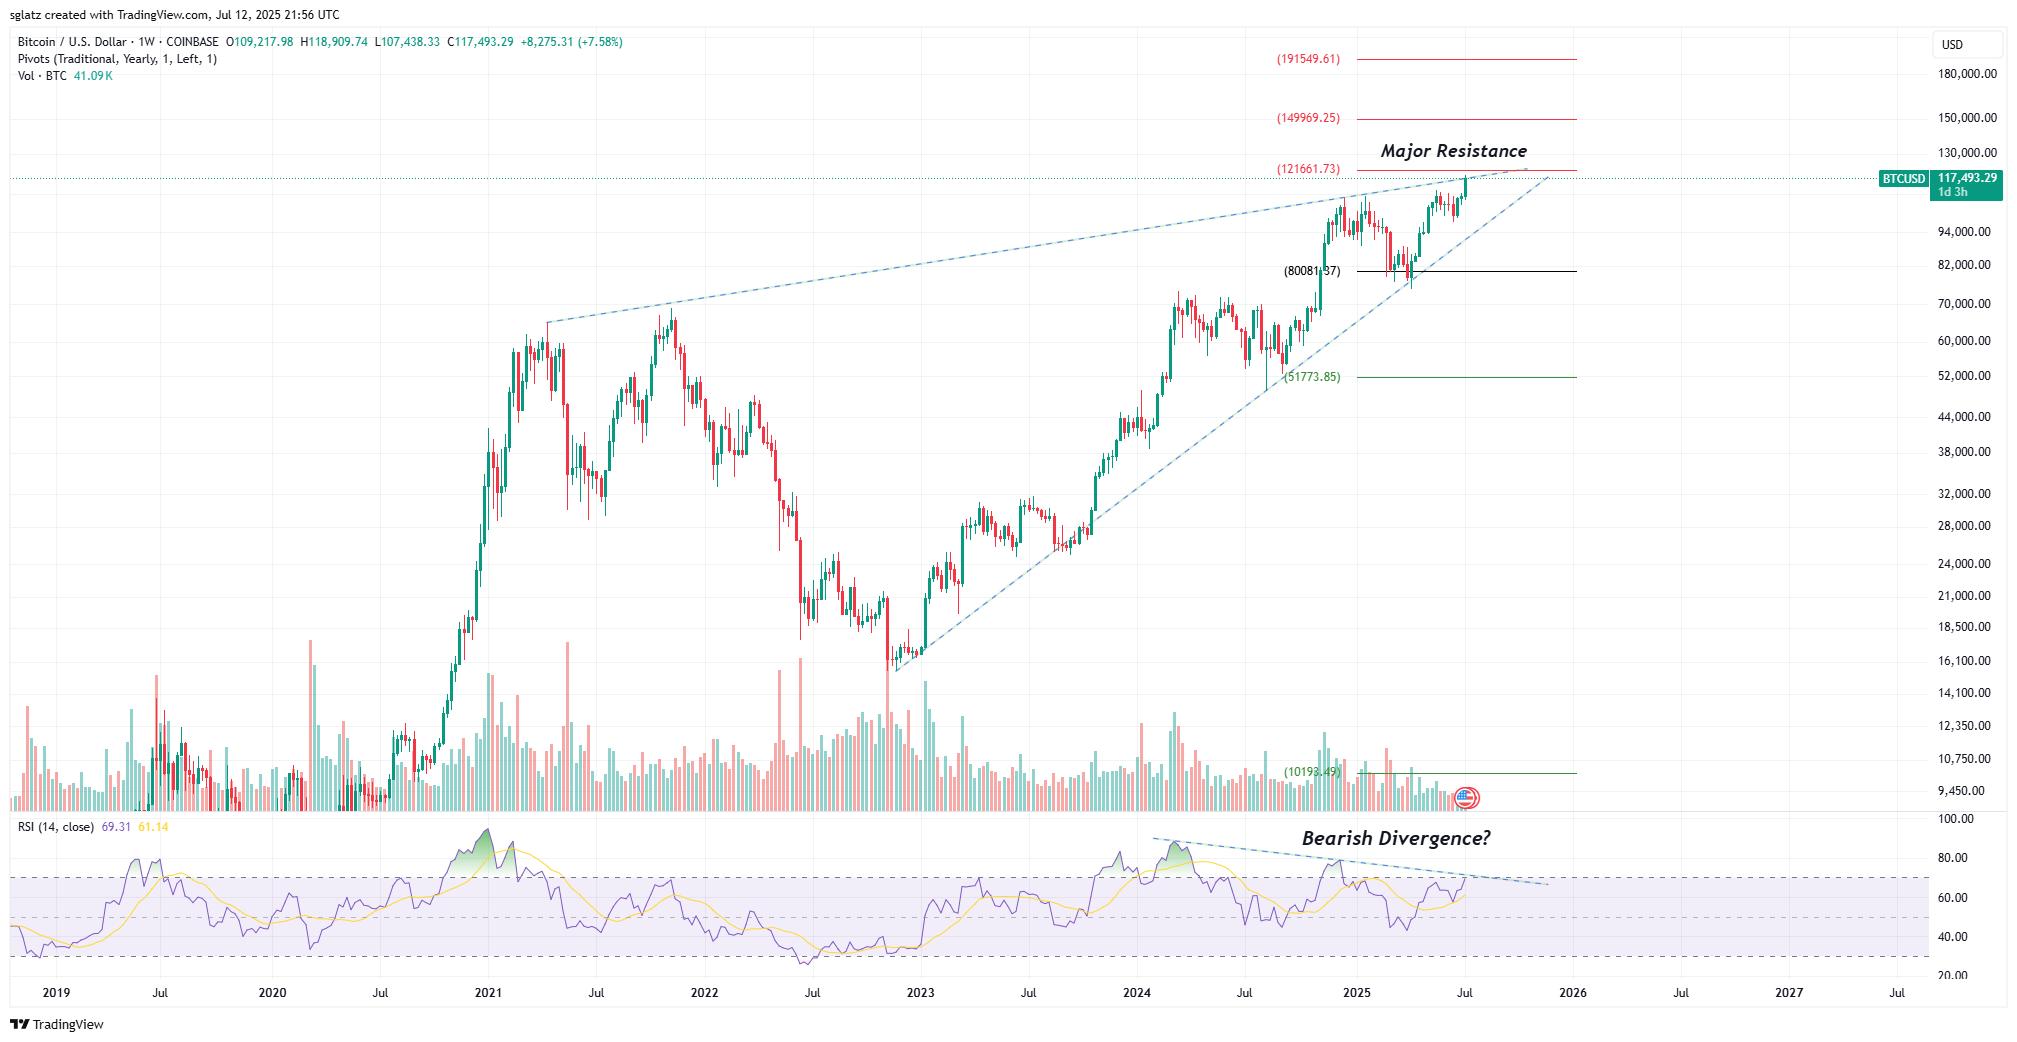
Price broke to all-time highs this week after lagging the strength in the Nasdaq in recent weeks, and is nearing a major resistance zone—the Yearly and Quarterly Pivots + trend when began at the 2021 peak. Note also the RSI is potentially building out a Bearish Divergence—where price makes higher highs but on decreasing momentum. We want to see what the price reaction will be around the upper limit marked in the chart before making any conclusions on direction.
Gold (Daily)

The key support level we’ve been watching in recent weeks successfully held and closed the week above the 10/20 EMAs. The RSI / Momentum has been reset to its floor support which suggests there’s a healthy runway of upside that lies ahead before we think about another consolidation. So long as the 50 EMA continues to hold, we have no concerns about deep corrections and happily ride our long positions.
Silver
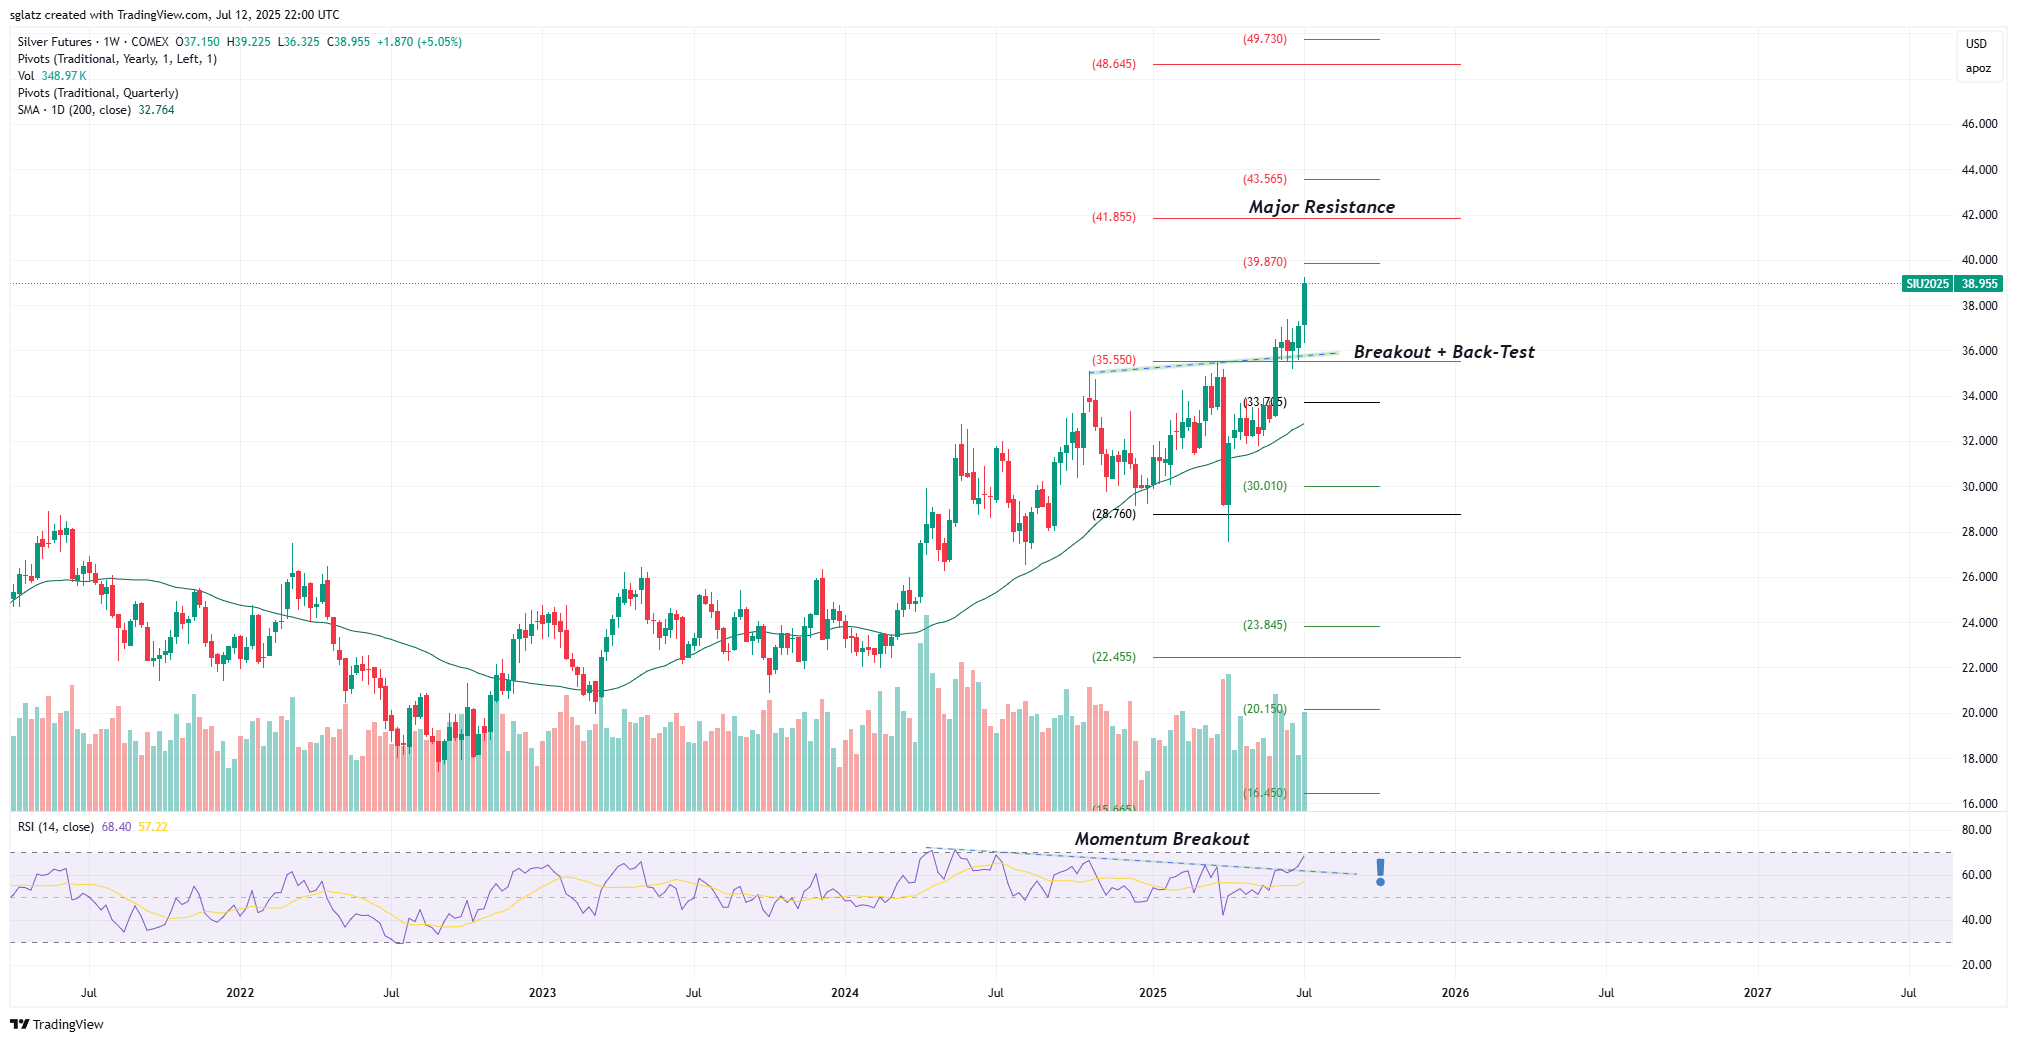
All systems are GO in silver. We’ve been watching this RSI structure for a while now and it finally cracked this week, with price exploding higher. Price is currently trading near decade highs and is firmly trending higher with little overhead resistance. This is the part of the move where we should expect sentiment and momentum to accelerate, as a lot of people begin to catch onto the historical breakout that’s underway. The next major resistance zones to watch are marked in the chart at $39.87 and $41.855.
SILJ - Silver Junior Miner ETF

The early week shakeout had everyone panicking and selling their positions, thinking the space produced a false breakout on Monday. Price instantly ripped higher the following day as silver broke out and the miners closed the week with a confirmed range breakout on very heavy volume. Like silver futures, we can expect a firm uptrend now that a lot of the resistance/congestion zones have been cleared out.